Azure Virtual Network (VNet)

The Azure Virtual Network (VNet) is like a container that provide traffic isolation and segmentation.

An Azure virtual network (VNet) is a representation of your own network in the cloud. You can control your Azure network settings and define DHCP address blocks, DNS settings, security policies, and routing. You can also further segment your VNet into subnets and deploy Azure IaaS virtual machines (VMs) and PaaS role instances, in the same way you can deploy physical and virtual machines to your on-premises datacenter. In essence, you can expand your network to Azure, bringing your own IP address blocks.

The termes which are used in VNet are as follows:

  • Virtual Network
    • Virtual Network Subnet
    • Gateway Subnet
  • Virtual Network Gateway
    • Viurtual VPN Gateway
  • Network Security Group (NSG) -> Can be assigned to
    • Virtual Network
    • Virtual Machine
    • Sunbet -> at subnet level would be prefered.
  • User Defined Routing (UDR) -> for customizing traffic.

We can have one to many VNets but of course there’s subscription limitation. All VNets are isolated boundries. But there’s different types of connectivity available between VNets according to the scenario.

Connectivity types

VNets PeeringThere’s two different VNets peering:
– Global Peering
– VNets Peering -> the VNets must be in the same region.
VPN Gateway/ TunnelThe VPN Gateway is used for different types of connectivity:
– VNet-to-VNet (Microsoft Doc)
– Site-to-site -> On-premises env to Azure VNet (Microsoft Doc)
– Point-to-site -> Laptop to Azure VNet
Express Route

Virtual Network Security

Provide network security with using

  • Network security group
  • Using attack simulation to access protection and detection capabilities of azure web application firewall (WAF)

Network Security Group (NSG)

The Network Security is applied to the network via Network Security Groups (NSGs) and it has the following features:

  • It has a stateful firewalll for inbount and outbound traffic.

Clouds: Virtual Network and Subnet

Web Application Firewall (WAF)

Common vulnerabilities [more]

  • Injection
  • Broker authentication
  • Cross-site scription (xss)
  • Sensitive Data Exposure
  • Insecure Deserlialization
  • Broker Access Control
  • Insufficient logging and monitoring
  • Server-side Request Forgery (SSAF)
  • Known Vulnerabilities
  • Security Misconfiguration

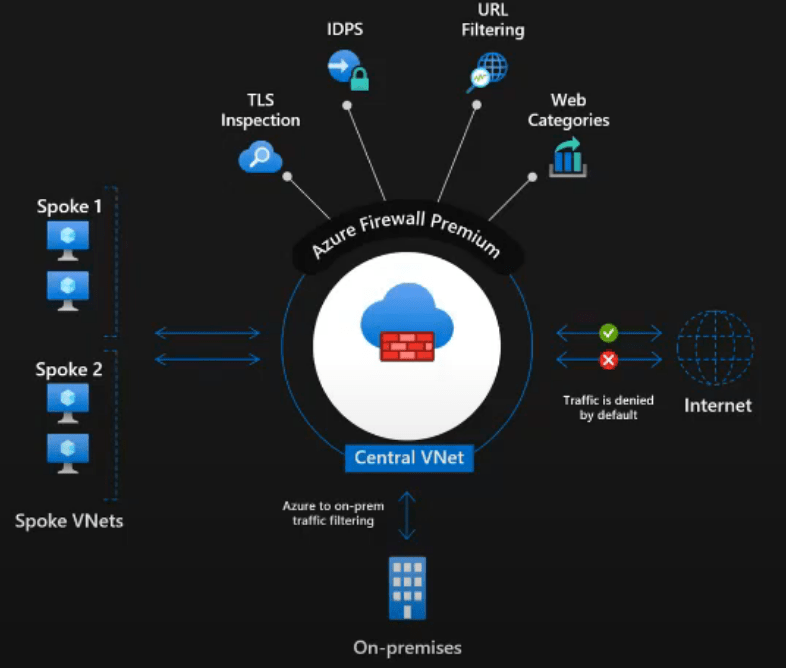
Central DNS Management and Logging with Azure Firewall

Azure Firewall overview [Source]

Firewall as a Service is a PaaS.

Azure Firewall
Central governance of all traffic flows– Built-in high availability and auto scale
– Network and application traffic filtering
– Centralized policy across VNets and subscriptions
Complete VNET protectionFilter Outbound, Inbound, Spoke-Spoke and Hybrid Connections traffic (VPN and ExpressRoute)
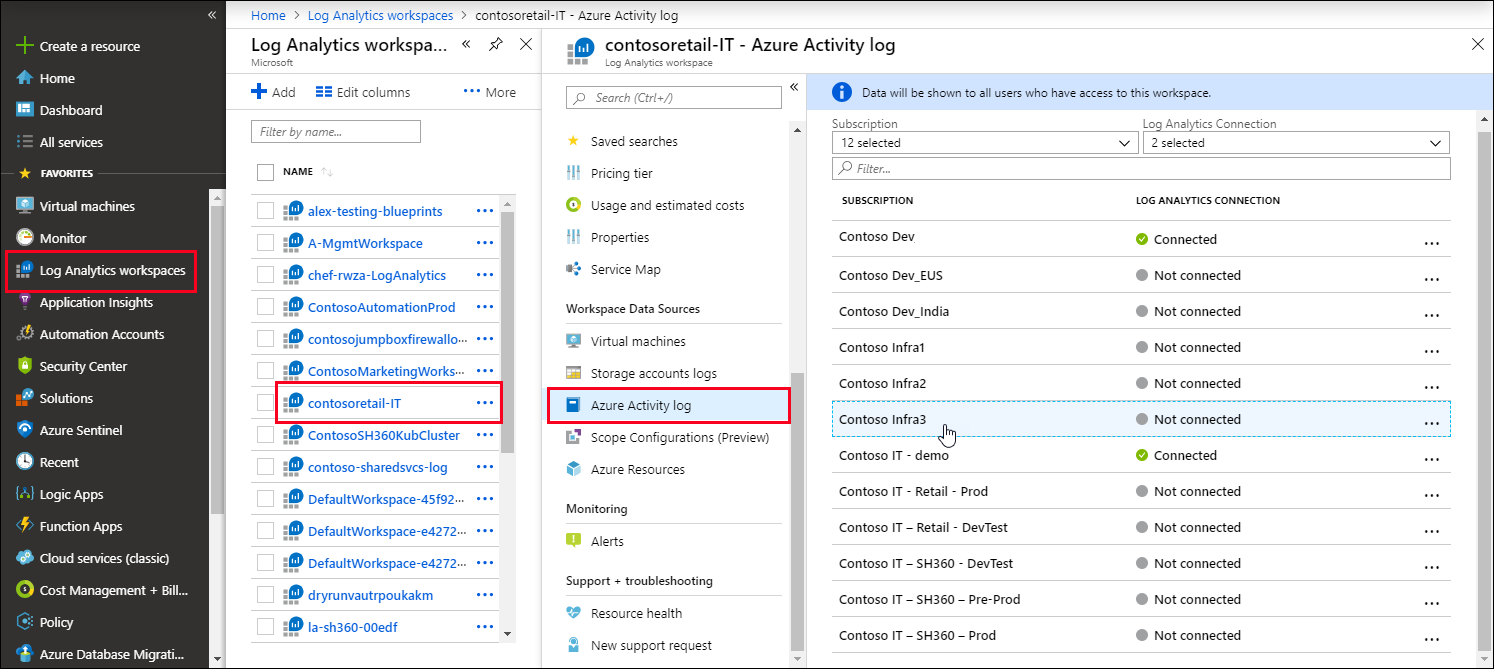
Centralized loggingArchive logs to a storage account, stream events to your Event Hub, or send them to Log Analytics or Security Integration and Event Management (SIEM) system of choice.
Best for AzureDevOps integration, FQDN tags, Service Tags, Integration with ASE, Backup and other Azure Services.
Azure Firewall PremiumNext-Gen Firewall features, including TLS inspection, IDPS, and URL Categories.

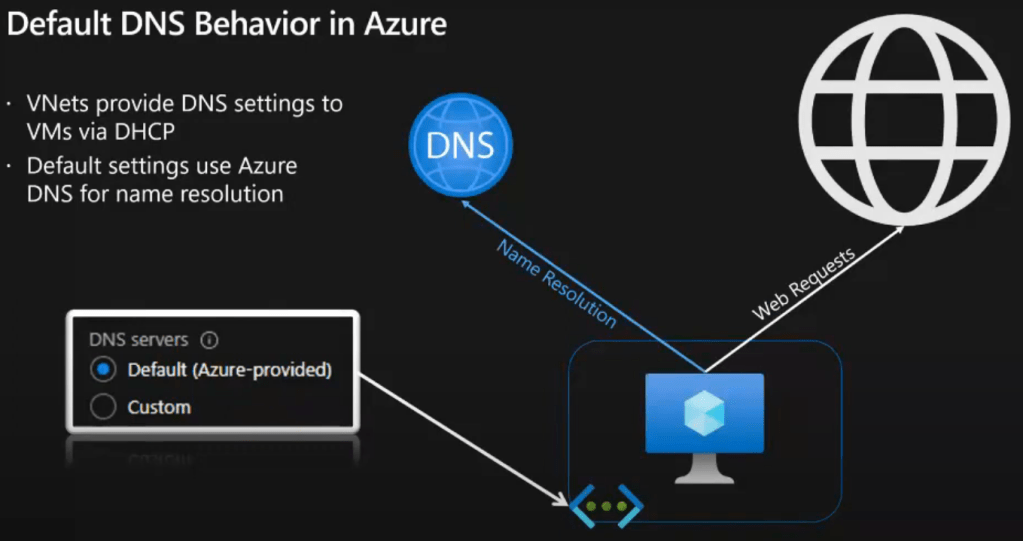
Default DNS behavior in Azure [Source]

  • VNets provide DNS settings to VMs via DHCP
  • Default settings use Azure DNS for name resolution

Azure Firewall DNS Proxy and custom DNS

References

Azure Service Bus

Service bus is available on azure platform with three different messaging possibilities:

  • Service Bus Queue
  • Service Bus Topic
  • Service Bus Relay
Service Bus QueueIt’s available for Basic Price Tier.
Service Bus TopicIt’s available for Standard / Premium Price Tier.
Service Bus Relay

Service Bus is usually for the enterprise level solutions, where the following items must be considered in the solution:

  • Multi components communicate with each other via brokered messaging
  • Communication is discrete.
  • A broker is needed to distribute the messages between components.
  • The message order is important (FIFO).
  • The application can have multi-tier architecture.
  • The application is hybrid (partially on-prem and partially cloud-based).
  • The applicaions of different departments must communicate with each other.

Service bus is created as a namespace and the message streamings are defined in the namespace and the price tier is defined at namespace level.

With Premium price tier is possible to define the Message Units. The message unit, isolate the workload processing in CPU and Memory. therefore, the partitioning option is removed from Create Queue and Topic blade. Two are features for premium are:

  • Event -> for automation
  • Firewall and virtual networks

Bus Service Overview

It’s available in Premium Price Tier

Shared Access Policies: in this blade we access the primary & secondary key & connection.

This is available in premium price tier

Queues: Add serveral queues.

Topics: Add several topics.

Secure Acceess

Uses the Shared Access Signature (SAS) with full access. This is generated by creating the service bus namesapace.

For Developers

The development has two parts

  • Sending message to the service bus queue
  • Handling/ process the messages in the service bus queue

Resources

Azure Activity Log

Azure Activity Log -> provides insights into subscription-level events.
Retention period of 90 days

Benefit of connecting Activity Log to Log Analytics

  • consolidate the activity logs of multi subscriptions in one place for analysis.
  • Store Activity Log enteries for more than 90 days.
  • Correlate Activity Log data with Azure Monitor data.
  • Use Log queries for complex analysis and get deep insight on Activity log.

Note
Each subscription has only one Activity Log.
Each Activity Log can be connected to only one Log Analytics Workspace.
One Log Analytics Workspace can be connected to the Activity Log of multiple subscription in a same tenant.

Connect an Activity Log to a Log Analytics workspace

Variante 1 (form log analytics blade)
Go to the Log Analytics Workspace > Select one of the created workspaces > From the blade > Azure Activity Log > Select one Subscription > Connect | Disconnect

Workspaces
Connect Workspaces

Variante 2 (from activity log blade)
Select a resource > Select Logs / Diagnostic settings menu > Select a Log Analytics Workspace.

Resources

Onboarding : Azure Monitor and Alert

Topics

Related topics

Available monitoring options

  • Azure Monitor: this codument go through the important aspects of it.
  • Azure Security Center
  • Azure Sentinel

Monitoring concepts

Each project need a holistic monitor strategy.

Scenario: A financial organization is moving its systems to Azure, with a mixture of IaaS and PaaS services. In its previous environment, the organization had several instances where systems failed or issues arose. There was an extended delay to engage resources and resolve the issues. This situation affected customers’ ability to access their accounts, and it influenced satisfaction.
The organization wants to design a monitoring strategy that encompasses all the solutions that it uses. There should also be insights and alerting into the accumulated log data. The organization wants to quickly identify and minimize the impact if systems fail in the future.

Continuous monitoring strategy

  • it can improve the ability to identify issues within application
  • it can help to improve customer experience
  • to monitor performance of infrustructure and application
  • monitor security risks and suspicious activity
  • collect information on issues and analyse and then respond
  • in long run, your organization will become more productive, cost-effective, secure, and competitive.
  • why monitor applications
    • to improve application health
    • configure alert and automated response to deal with issues
    • to improve the development lifecycle, we can use monitoring, therefore we would be ready when we go to production
  • why monitor infrustructures
    • because of issues that could render the entire infrastructure unavailable
    • because of threats to security (these can have impact on productivity, financial loss, damage organization reputation )
    • risk of suspicious user account
    • malicious ip addresses
    • create automated response to alerts with playbooks and webhook.
    • learn from issues, strengthen protection, build an improved infrastructure
Availability of applications
even in development phase monitoring can help developers

Azure Monitor agents

Azure Diagnostics Extension
  • An agent in azure monitor
  • Collects monitoring data from guest operating systems of azure compute resources include virtual machines.
  • We don’t pay for the extension but we pay for data ingestion
  • Data destination is azure storage account or other data sinks (additional destinations).

Scenarios

  • Collect guest metrics into azure monitor metrics (collect logs from middle-tier/vm and transfer to azure monitor)
  • Send guest logs and metrics to azure storage for archiving
  • Send guest logs and metrics to azure event hubs to send outside of azure

Data collected

Windows (WAD)Linux (LAD)
Windows event logsSyslogs
Performance countersPerformance counters
IIS logsLog files
Application logs
.Net eventsource logs
Manifest based ETW logs
Crash dumps log
File based logs
Agent disgnostic logs

Sources

Azure Log Analytics Agent
Azure Diagnostics ExtensionAzure Log Analytics
Only Azure VMsAzure/other clouds/on-prem VMs,
Sends data to azure storage, azure monitor metrics (only win), and event hubs.collects data to azure monitor logs.
is required for solutions, azure monitor for vms, azure security center, und…
Windows Agents

Coming soon…

Linux Agents

Coming soon…

Dependancy Agent

Coming soon…

Azure Monitor Logs

  • powerfull query language for joining data from multiple tables
  • with virtual presentation
  • extracts valuable information about infrastructure from log data
  • monitor health of the services
  • it’s for collecting and analyzing telemetry
  • helps to have max performance and availability for cloud application & on-prem
  • it collects data in azure monitor
  • azure monitor collects two fundamental types of data
    • metrics: tell you how the resource is performing and consuming other resources
    • logs: when the resource created and modified
Diagram of Azure Monitor's architecture displaying the sources of monitoring data, the data stores, and functions performed on the data.
high-level view of Azure Monitor[Source]
  • azure monitor is automatic system, it collects data as soon as the resource is created
  • azure monitor data can be extended
    • enabling diagnostics:
    • adding an agent: it’s for vms via installing log analytics agent and sending data to log analytics workspace.
    • custome code via Data Collector API
  • Logs (recommended for analyzing)
    • time-stamped information about changes made to resource
    • types are numeric, text, events
    • You can store metric data in logs to combine them with other monitoring data for analysis
    • You log data from Azure Monitor in a Log Analytics workspace
    • Azure provides an analysis engine and a rich query language (Kusto)
  • metrics (recommended for alerting)
    • Metrics are numerical values that describe some aspect of a system at a point in time
    • The metrics are collected at regular intervals and are useful for alerting because of their frequent sampling.
    • Metrics are stored in a time-series database
    • Metrics are suited for alerting and fast detection of issues

Source: https://docs.microsoft.com/en-us/learn/modules/analyze-infrastructure-with-azure-monitor-logs/1-introduction

Monitoring Best Practices

Sources

What’s alert?

  • A proactive notificaion when an important notification found in monitoring (response to incidents).
  • Alert is raised before customer identifies and addresses an issue.
  • Unified alerts are managed by log analytics and application insights.
  • The previous type of alert are classic alerts.
  • Alerts are raised for matrics and logs. Ex. Metric values, Log search queries, Activity log event, Health of the underlying azure platform, test for website availability.

Alert states

Alert stateDescription
NewIssue has been detected but has not been reviewed.
AcknowlagedAdministrator has reviewed the alert and started working on it.
ClosedIssue has been resolved.

NOTE : The state changes are stored in alert’s history.

Alert states are independent of Monitor condition (fired or resolved).

Different type of reaction to an incident

  • Alerts & alert rules & action group
  • Classic alerts
  • Metric alerts
  • Log alerts
  • Activity log alerts
  • common alert schema
  • Smart groups (aggregation of lalerts base on machine learning algorithms)
  • Auto scale
  • Change analysis

Permission and privilages

We can use the Role-based access control (RBAC) at different levels

  • Subscription Level
  • Resource Level

The RBACs which are available for Azure Monitor service are the following:

  • Monitoring Contributor
  • Monitoring Metrics Publisher
  • Monitoring Reader

Ex. A user with the Monitoring contributor access for VM1 can only consume and mange the alert that have been generated for VM1.

Add new Alert

Alerts are defined via Azure Minitor Service blade.

Go to Azure portal > Monitor service> Go to Alerts section > Use add alert rule button.

According to the seleced resource there’s different signals available.

Signal types

  • Metrics
  • Activity logs

The alert configuration is different respectively. But without considering the signal types always we need the following items for creating an alert rule in Azure Monitor Service.

Resource
(For the scope of Alert Rule)
The scope of alert is specified in this step.
– Subscription level
– Resource Group level
– Region
– A specific resource
– One Alert Rule for multiple resources with the same Resource Type is available.
ConditionThe monitoring criteria.
Action GroupCollection of notifications.

Resources


You owe your dreams your courage.

Koleka Putuma