

Topics
- Key concepts
- Monitoring concept
- CloudWatch
- How to use CloudWatch
- CloudWatch Alert
- Recovering From Failure by using CloudTrail
- Automating recovery
- Chaos engineering
- Edge cases
Related topics
Key concepts
CloudWatch 
CloudTrail 
Alert 
Simple Notification Syetem 
Athena
- Monitoring : is for understanding what is happening in your system.
- Alerting : is CloudWatch component, is counterpart to monitoring, and it allows the platform to let us know when something is wrong.
- Recovering : is for identifying the cause of the issue and rectifying it.
- Automating
- Alert:
- Simple Notification System:
- CloudTrail: with enabling CloudTrail on your AWS account, you ensure that you have the data necessary to look at the history of your AWS account and determine what happened and when.
- Amazon Athena: which lets you filter through large amounts of data with ease.
- SSL certificate: Cryptographic certificate for encrypting traffic between two computers.
- Source of truth: When data is stored in multiple places or ways, the “source of truth” is the one that is used when there is a discrepancy between the multiple sources.
- Chaos Engineering: Intentionally causing issues in order to validate that a system can respond appropriately to problems.
Monitoring concept
Without monitoring, you are blind to what is happening in your systems. Without having knowledgable folks alerted when things go wrong, you’re deaf to system failures. Creating systems that reach out to you and ask you for help when they need it, or better yet, let you know that they might need help soon, is critical to meeting your business goals and sleeping easier at night.

Once you have master monitoring and alerting, you can begin to think about how your systems can fix themselves. At least for routine problems, automation can be a fantastic tool for keeping your platform running seamlessly [Source].

Monitoring and responding are core to every vital system. When you architect a platform, you should always think about how you will know if something is wrong with that platform early on in the design process. There are many different kinds of monitoring that can be applied to many different facets of the system, and knowing which types to apply where it can be the difference between success and failure.

CloudWatch
- CloudWatch is the primary AWS service for monitoring
- it has different pieces that work together
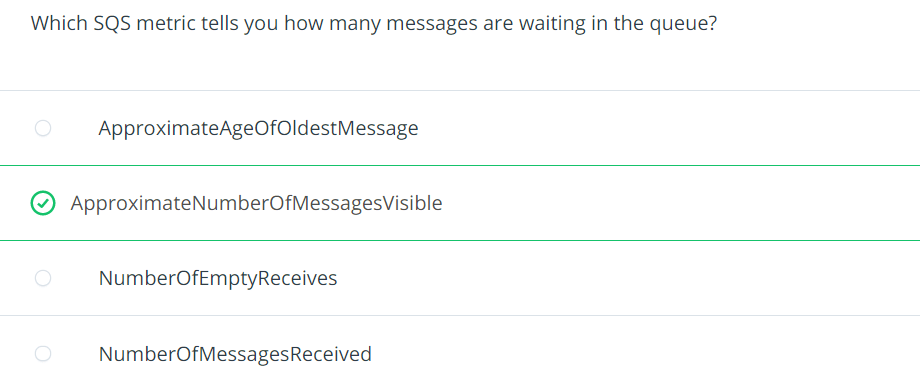
- CloudWatch metrices are the main repository of monitoring metrics e.g. what does the CPU utilization look like on your RDS database, or how man messages are currently in SQS (Simple Queue Service)
- we can create custom metrics
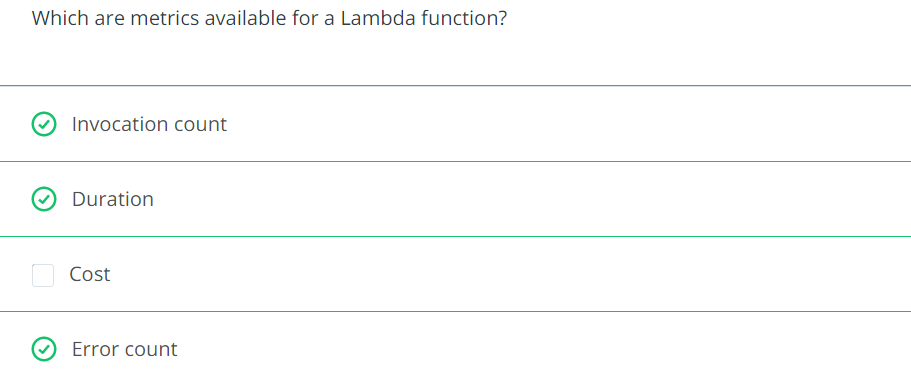
- CloudWatch Logs is a service for storing and viewing text-based logs e.g. Lambda, API Gateway,…
- CloudWatch Synthetics are health checks for creating HTTP endpoints
- CloudWatch Dashboard
- CloudWatch Alarms
List of AWS services that push metrics into CloudWatch: https://docs.aws.amazon.com/AmazonCloudWatch/latest/monitoring/aws-services-cloudwatch-metrics.html
Refer to AWS : Serverless post to create a simple Lambda for testing CloudWach.
How to use CloudWatch
This is the overview > metrices

You see the list of namespaces. Lambda is one of them.
CloudWatch Alert [Source]
- cloudwatch doesn’t alert you
- cloudwatch alert inform you
- Proper alerting will help you keep tabs on your systems and will help you meet your SLAs
- Alerting in ways that bring attention to important issues will keep everyone informed and prevent your customers from being the ones to inform you of problems
- CloudWatch Alarms integrates with CloudWatch Metrics
- Any metric in CloudWatch can be used as the basis for an alarm
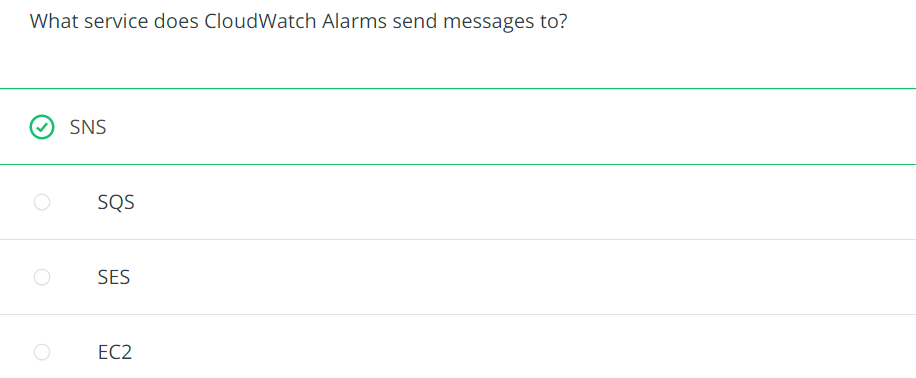
- These alarms are sent to SNS topics, and from there, you have a whole variety of options for distributing information such as email, text message, Lambda invocation or third party integration.
- Alerting when problems occur is critical, but alerting when problems are about to occur is far better.
- Understanding the design and architecture of your platform is key to being able to set thresholds correctly
- You want to set your thresholds so that your systems are quiet when the load is within their capacity, but to start speaking up when they head toward exceeding their capacity. You will need to determine how much advanced warning you will need to fix issues.

Example: create a Lambda function and set up an alert on a Lambda functions invocation in CloudWatch Alarms to email you anytime that the Lamdba is run.

Solution has been recorded in video
Recovering From Failure by using CloudTrail
The key to recovering from failure is identifying the root cause as well as how and who/what triggered the incident.
We can log
- management events (first copy of management events is free of charge but extra copies arre each 2$ for 100,000 write management events [Source])
- data events (pay $0.10 per 100,000 data events)
You will be able to refer to this CloudTrail log for a complete history of the actions taken in your AWS account. You can also query these logs with Amazon Athena, which lets you filter through large amounts of data with ease.


Automating recovery
Automating service recovery and creating “self-healing” systems can take you to the next level of system architecture. Some solutions are quite simple. Using autoscaling within AWS, you can handle single instance/server failures without missing a beat. These solutions will automatically replace a failed server or will create or delete servers based on the demand at any given point in time.
Beyond the simple tasks, many types of failure can be automatically recovered from, but this can involve significant work. Many failure events can generate notifications, either directly from the service, or via an alarm generated out of CloudWatch. These events can have a Lambda function attached to them, and from there, you can do anything you need to in order to recover the system. Do be cautious with this type of automation where you are, in essence, turning over some control of the platform – to the platform. Just like with a business application, there can be defects. However, as with any software, proper and thorough testing can help ensure a high-quality product.

Some aws services can autoscale to help with some automated recovery.

Chaos engineering
Chaos Engineering is the practice of intentionally breaking things in production. If your systems can handle these failures, why not allow or encourage these failures?
Set rational alerting levels for your system so that for foreseeable issues, you get alerted so that you can take care of issues before they become critical.

Edge cases [Source]
Many applications and services lend themselves to being monitored and maintained. When you run into an application that does not, it is no less important (it’s like more important) to monitor, alert and maintain these applications. You may find yourself needing to go to extremes in order to pull these systems into your monitoring framework, but if you do not, you are putting yourself at risk for letting faults go undetected. Ensuring coverage of all of the components of your platform, documenting and training staff to understand the platform and practicing what to do in the case of outages will help ensure the highest uptime for your company.


You owe your dreams your courage.
Koleka Putuma

One thought on “AWS : Monitor, React, and Recover”